FOR 22 YEARS
| Weekend Gross | Total Gross | Weeks on chart | % diff last week | |||
|---|---|---|---|---|---|---|
| 1. | 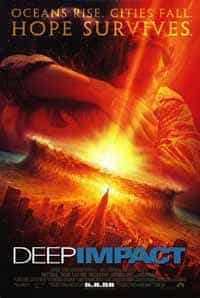 |
Deep Impact |
£1,601,651 | £4,006,116 | 2 | -9% |
| 2. | 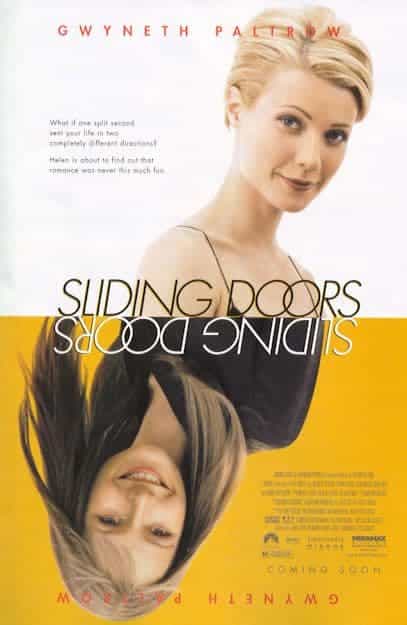 |
Sliding Doors |
£859,944 | £4,453,101 | 4 | 23% |
| 3. | 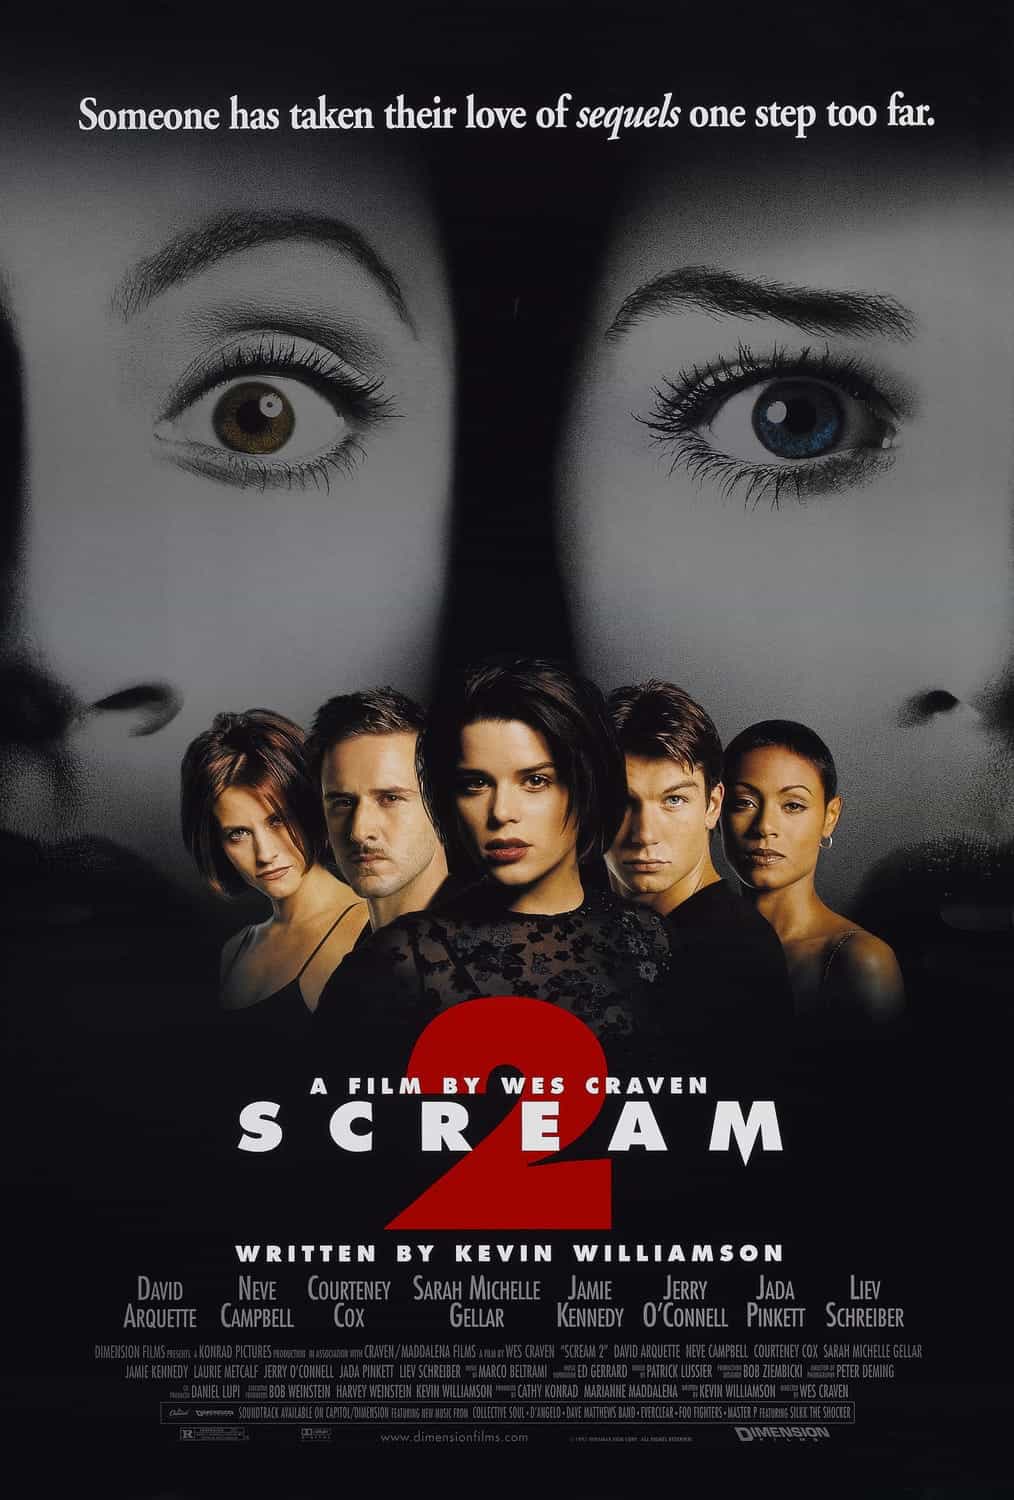 |
Scream 2 |
£457,661 | £5,577,486 | 4 | -13% |
| 4. | 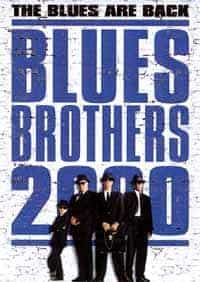 |
Blues Brother's 2000 |
£261,956 | £261,956 | New | |
| 5. | 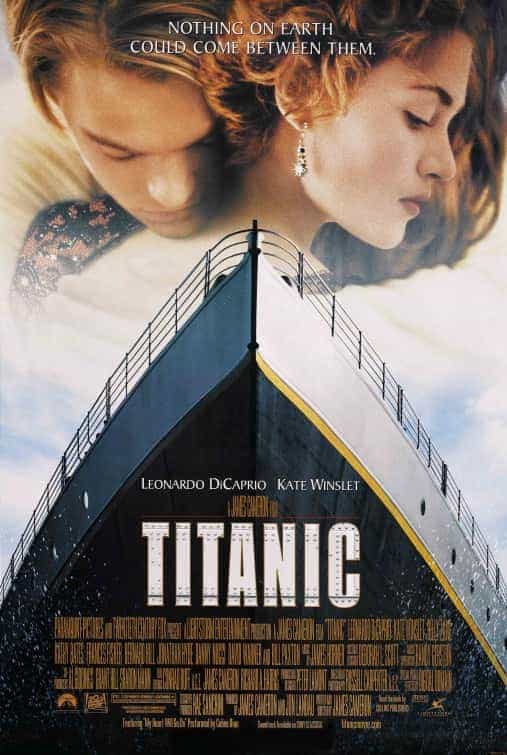 |
Titanic |
£199,618 | £61,996,461 | 18 | 21% |
| 6. | 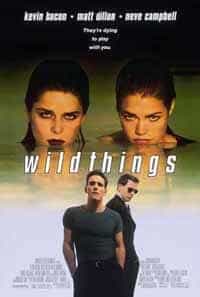 |
Wild Things |
£198,701 | £448,953 | 2 | 9% |
| 7. | 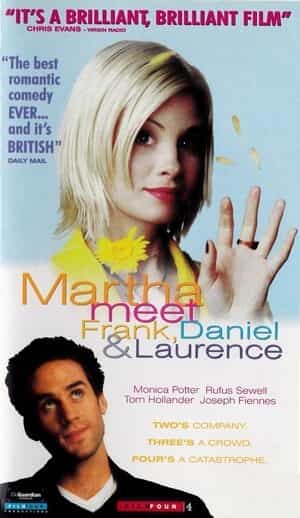 |
Martha Meet Frank Daniel and Laurence |
£173,355 | £788,350 | 3 | 6% |
| 8. | 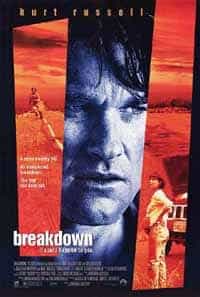 |
Breakdown |
£150,579 | £1,521,206 | 4 | 9% |
| 9. | 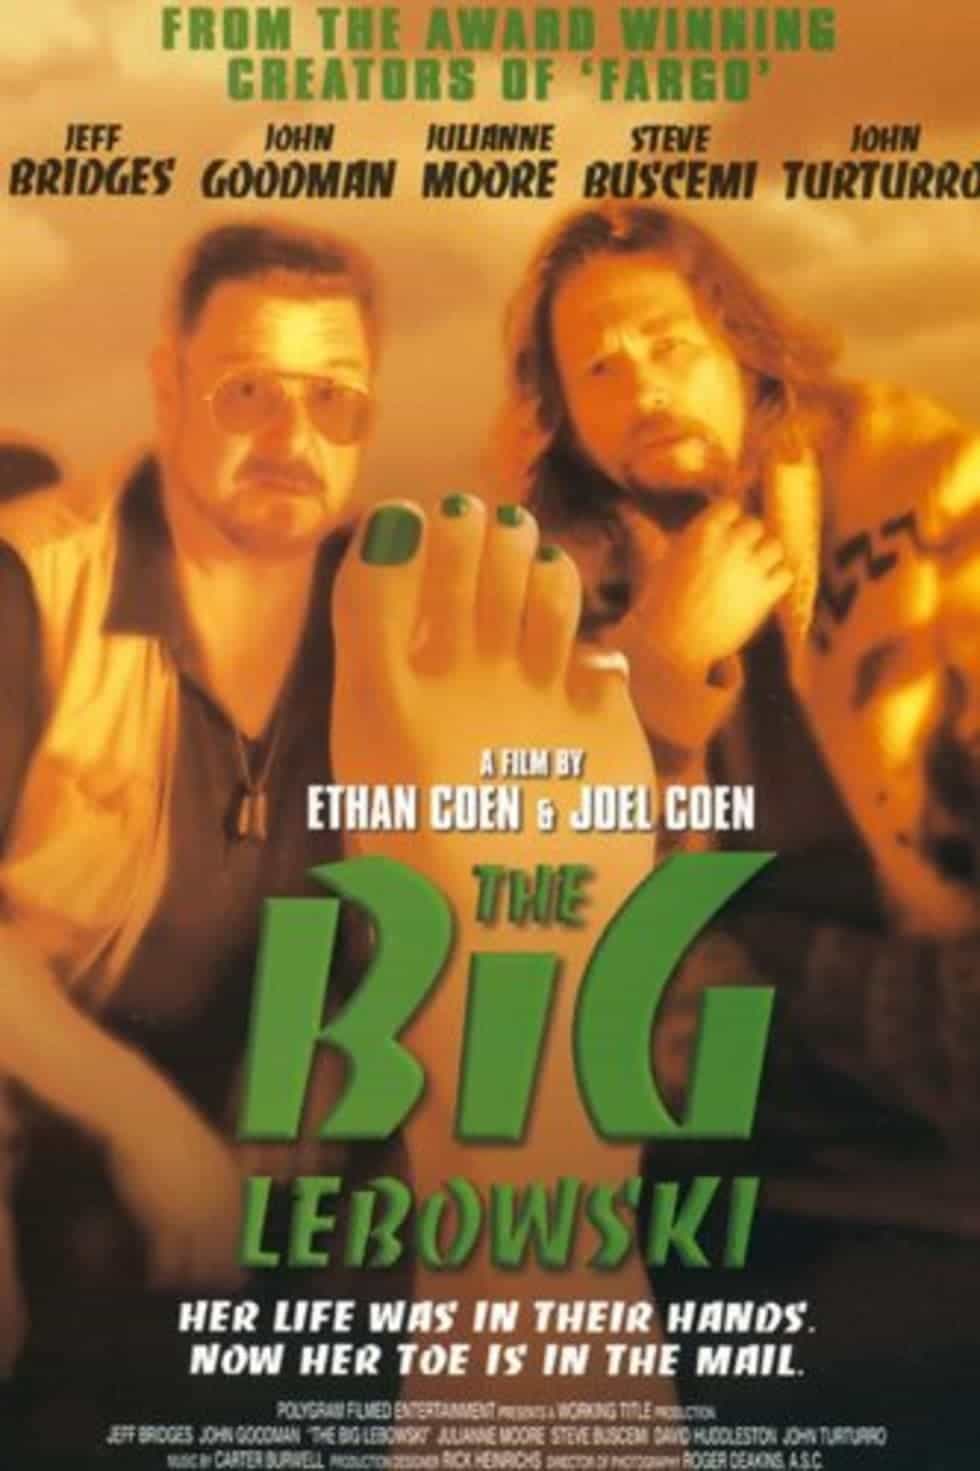 |
The Big Lebowski |
£133,251 | £860,794 | 5 | 43% |
| 10. | 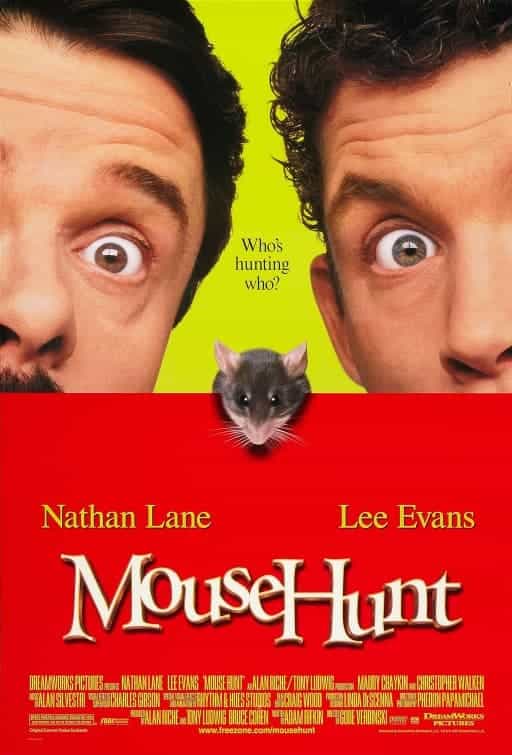 |
Mousehunt |
£100,810 | £4,814,675 | 8 | 39% |
| 11. | 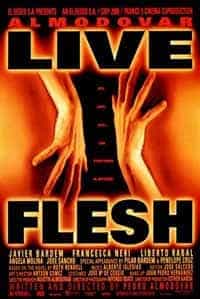 |
Live Flesh |
£81,318 | £165,839 | 2 | 31% |
| 12. | 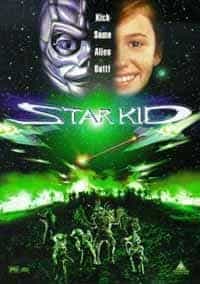 |
Star Kid |
£79,008 | £79,008 | New | |
| 13. | 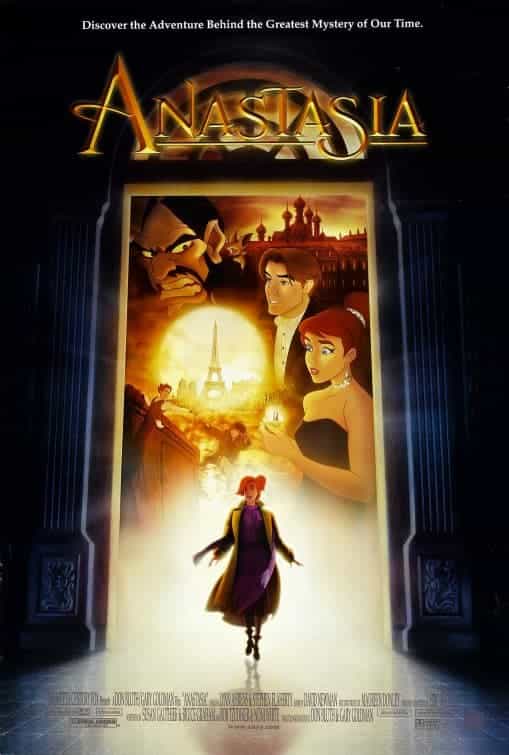 |
Anastasia |
£57,607 | £3,401,137 | 8 | -28% |
| 14. | 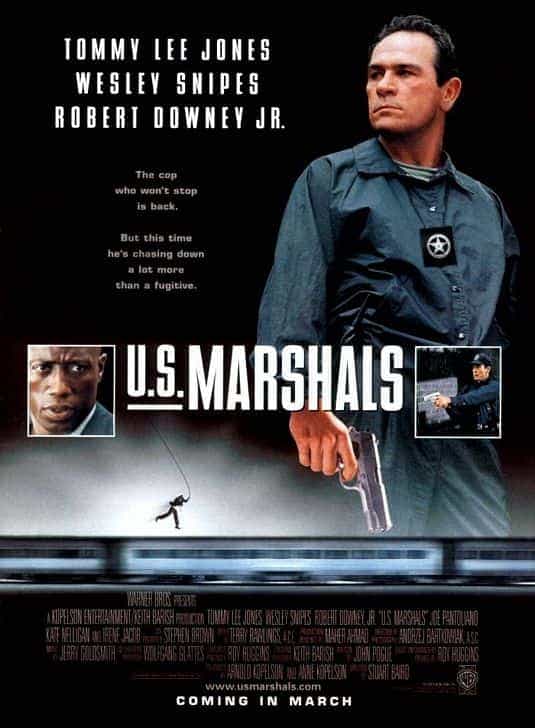 |
U.S. Marshals |
£50,742 | £1,779,080 | 5 | -7% |
| 15. | 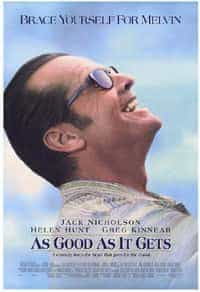 |
As Good As It Gets |
£48,176 | £7,325,264 | 11 | 16% |