FOR 22 YEARS
| Weekend Gross | Total Gross | Weeks on chart | % diff last week | |||
|---|---|---|---|---|---|---|
| 1. | 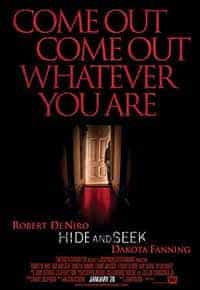 |
Hide and Seek |
£1,594,508 | £1,594,508 | New | |
| 2. | 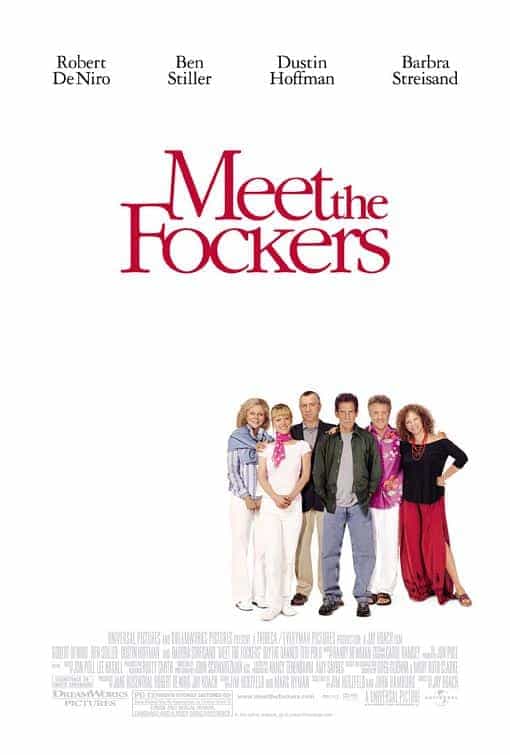 |
Meet the Fockers |
£1,035,103 | £26,317,132 | 5 | -45% |
| 3. | 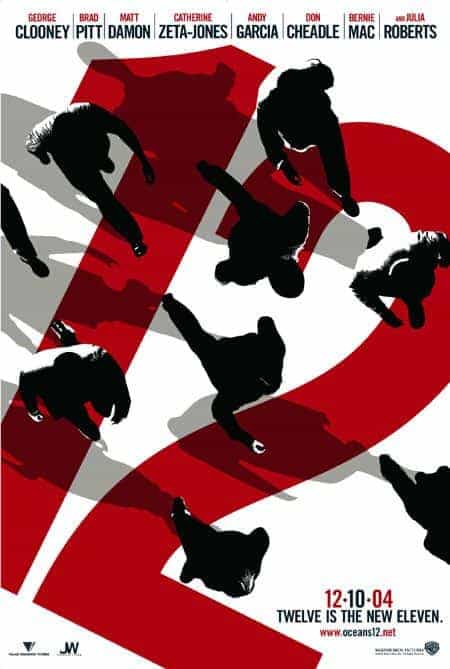 |
Ocean's Twelve |
£651,764 | £11,422,858 | 4 | -51% |
| 4. | 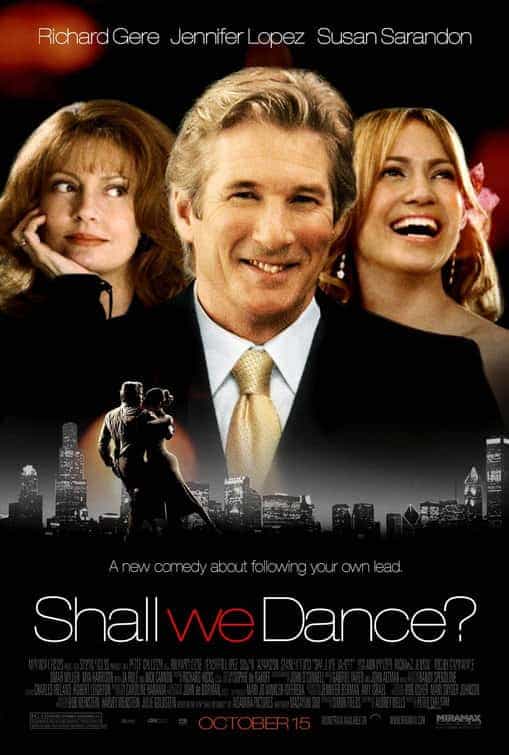 |
Shall We Dance? |
£643,995 | £2,262,721 | 2 | -40% |
| 5. |  |
Are We There Yet? |
£587,711 | £1,672,108 | 2 | -34% |
| 6. |  |
The SpongeBob Squarepants Movie |
£553,928 | £4,840,795 | 3 | -51% |
| 7. |  |
The Magic Roundabout |
£534,778 | £5,200,794 | 3 | -53% |
| 8. |  |
The Life Aquatic With Steve Zissou |
£502,041 | £502,041 | New | |
| 9. |  |
Coach Carter |
£469,062 | £469,062 | New | |
| 10. |  |
Racing Stripes |
£381,608 | £5,214,705 | 4 | -55% |
| 11. |  |
Spanglish |
£308,414 | £308,414 | New | |
| 12. |  |
Son of the Mask |
£298,348 | £2,928,158 | 3 | -57% |
| 13. |  |
Sideways |
£274,905 | £2,676,546 | 5 | -26% |
| 14. |  |
In Good Company |
£227,838 | £1,074,695 | 2 | -62% |
| 15. |  |
The Aviator |
£189,488 | £7,885,636 | 10 | -19% |