FOR 22 YEARS
| Weekend Gross | Total Gross | Weeks on chart | % diff last week | |||
|---|---|---|---|---|---|---|
| 1. |  |
Ant-Man and the Wasp Quantumania |
£8,834,435 | £8,834,435 | New | |
| 2. |  |
Puss In Boots: The Last Wish |
£3,170,746 | £17,156,100 | 3 | 3% |
| 3. |  |
Magic Mike's Last Dance |
£888,435 | £3,842,057 | 2 | -42% |
| 4. |
Avatar: The Way of Water |
£531,213 | £75,746,774 | 10 | -36% | |
| 5. |  |
Epic Tails |
£332,566 | £1,150,587 | 2 | 22% |
| 6. | 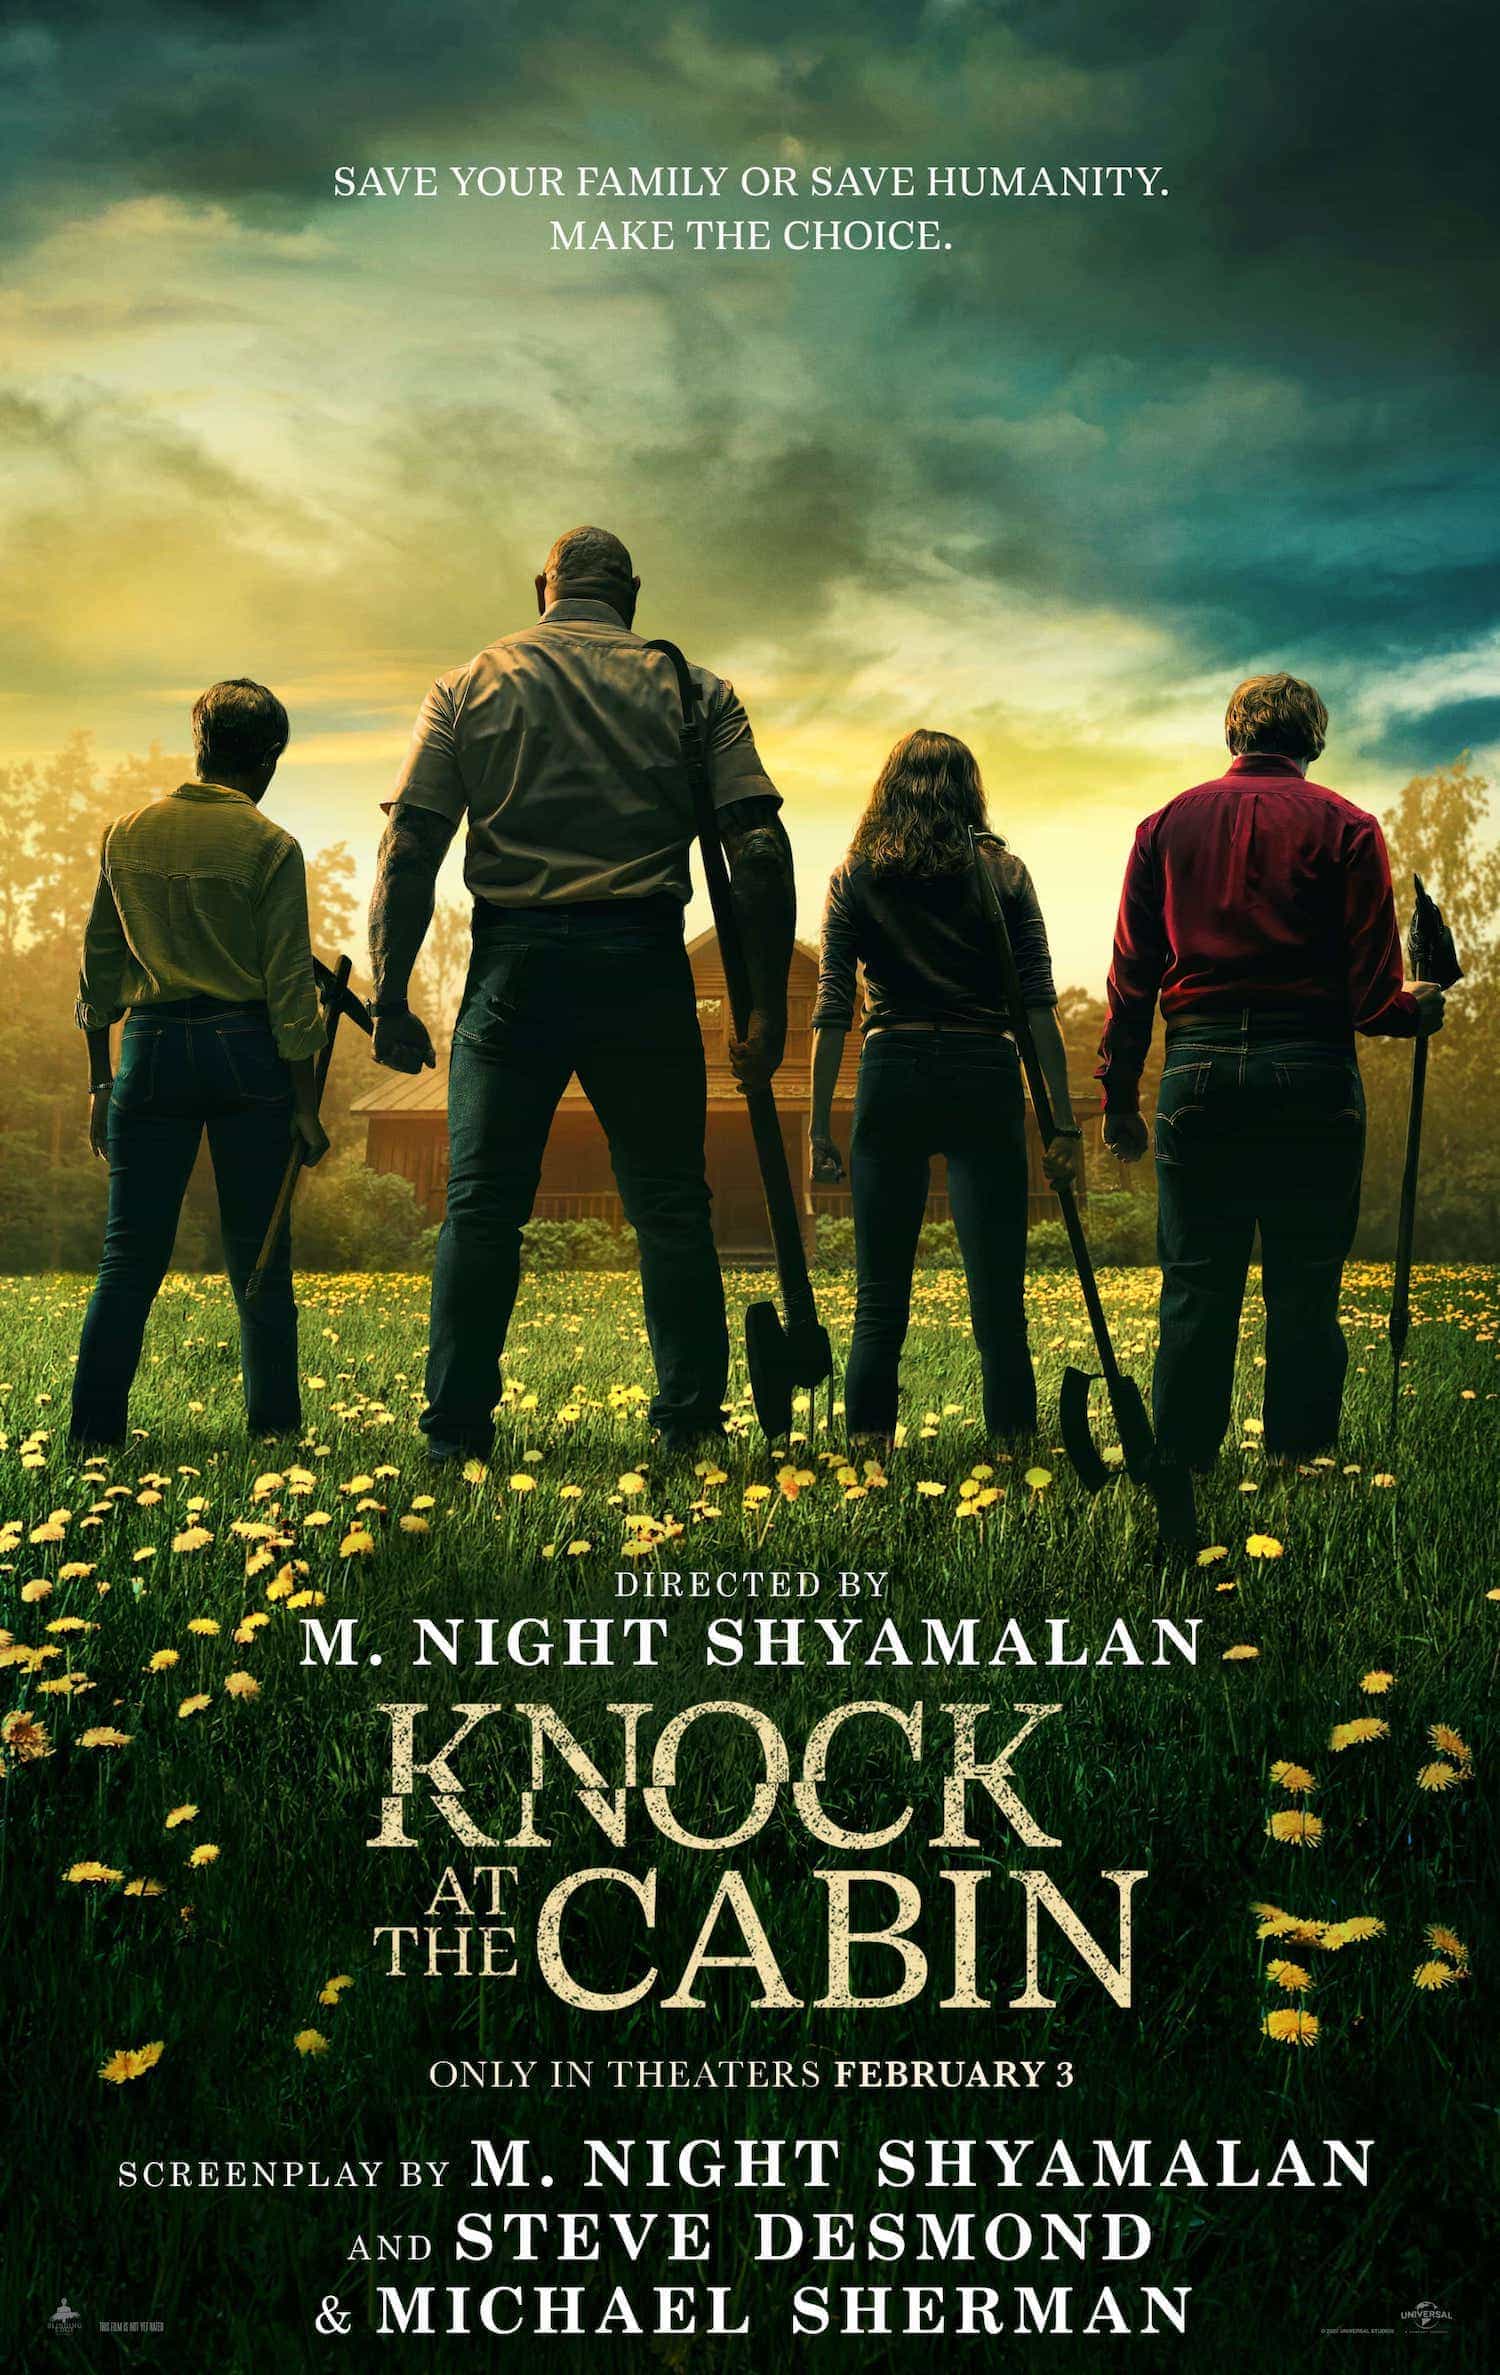 |
Knock At the Cabin |
£270,176 | £2,757,790 | 3 | -50% |
| 7. | 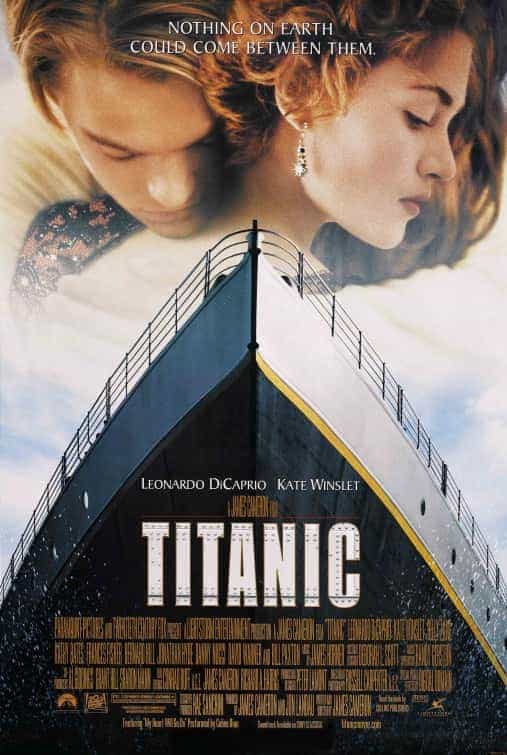 |
Titanic |
£268,174 | £2,143,864 | 38 | -69% |
| 8. | 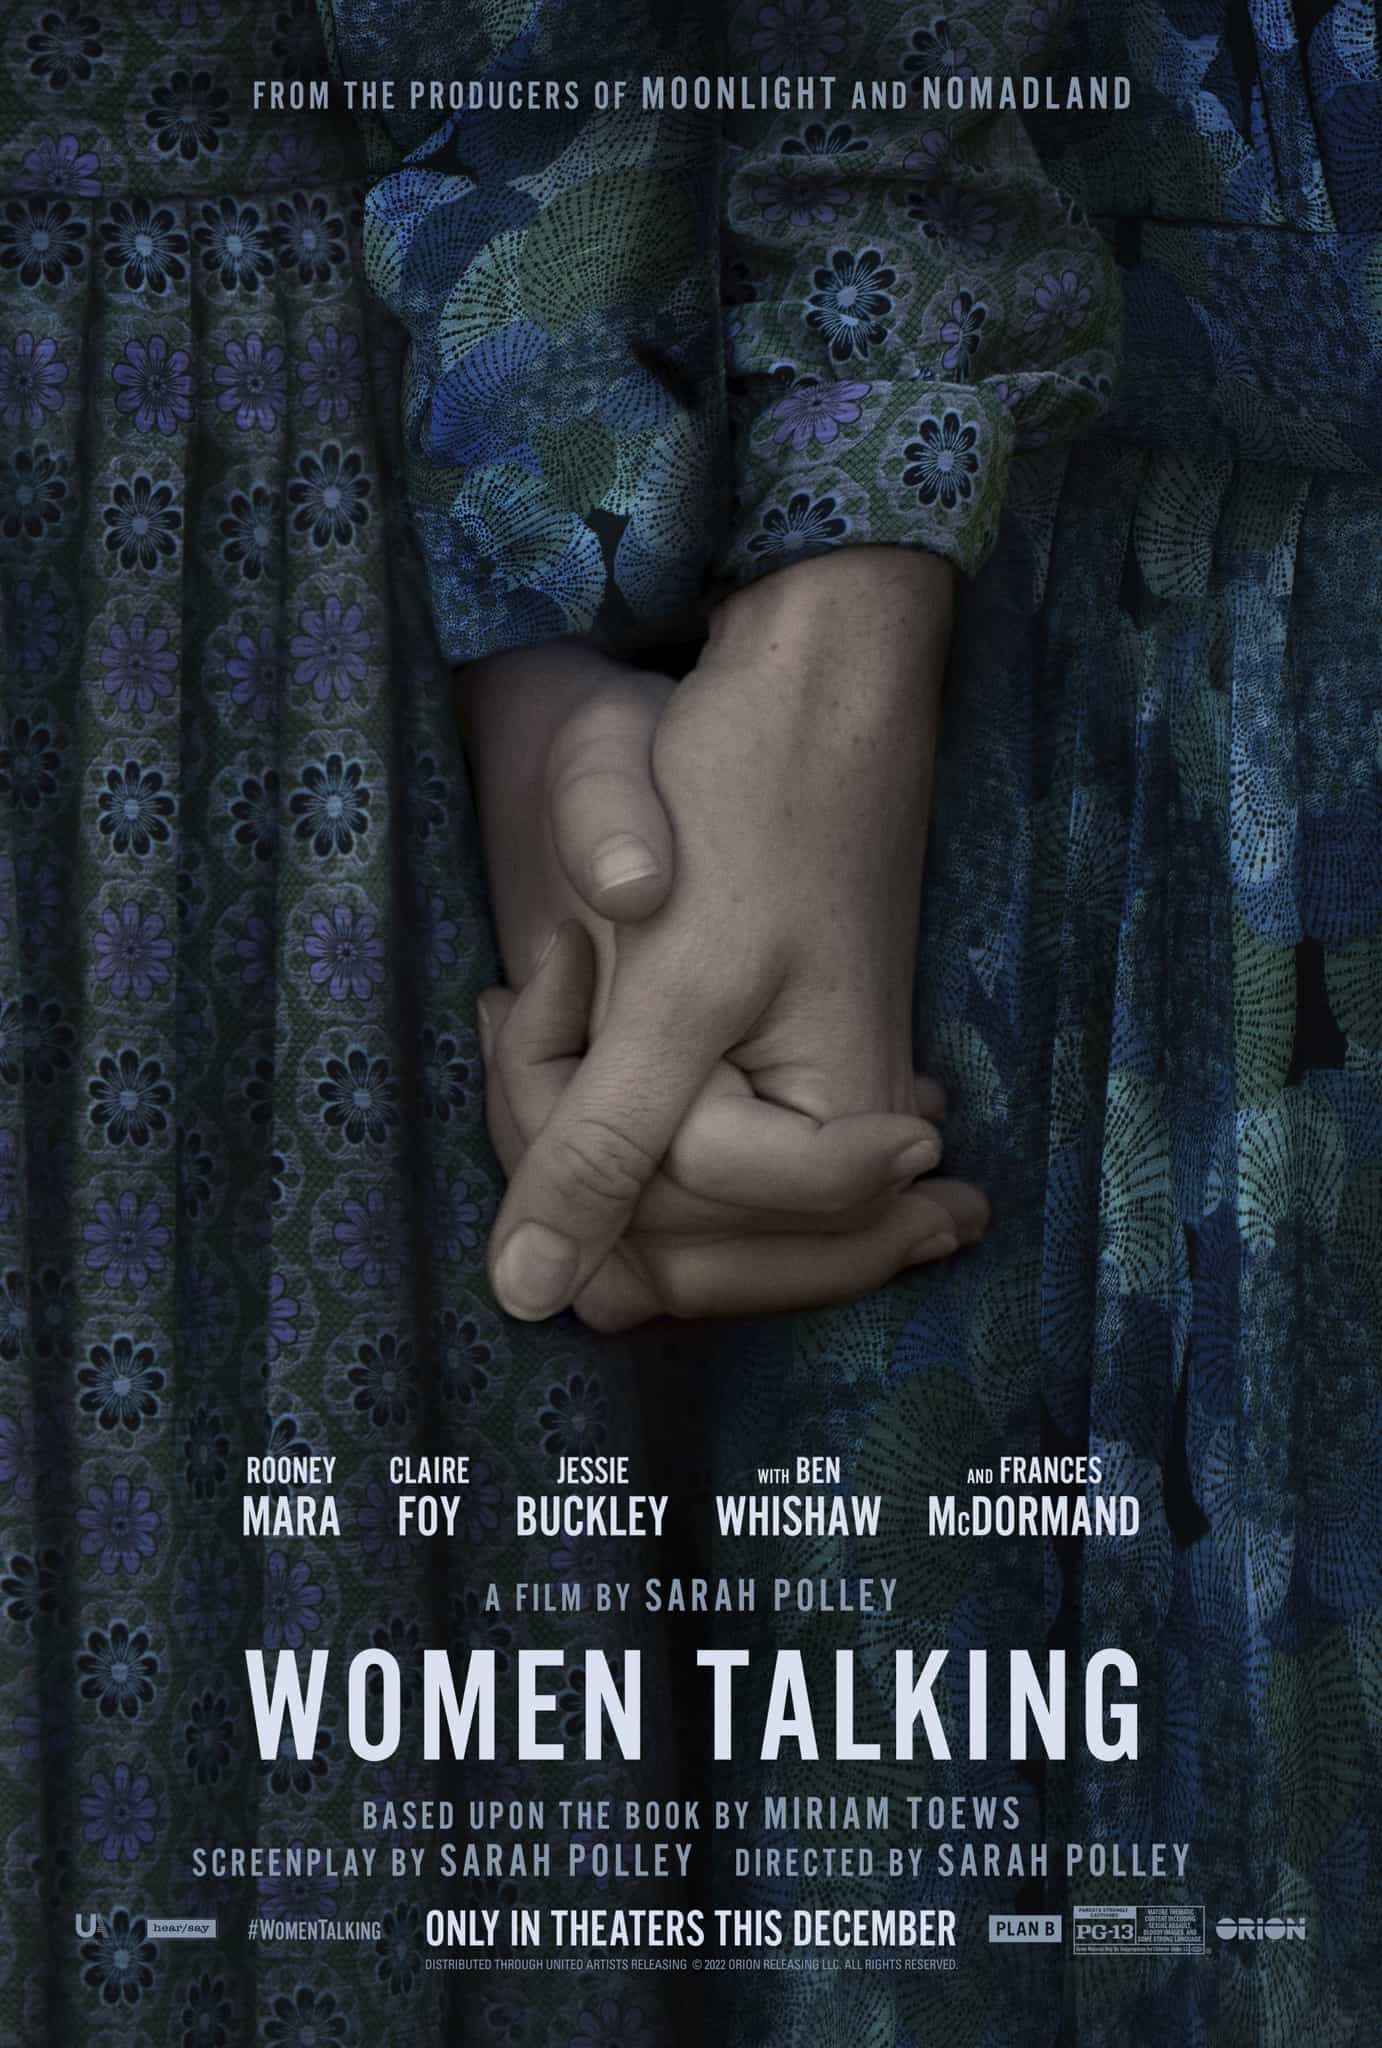 |
Women Talking |
£182,832 | £374,465 | 2 | 36% |
| 9. | 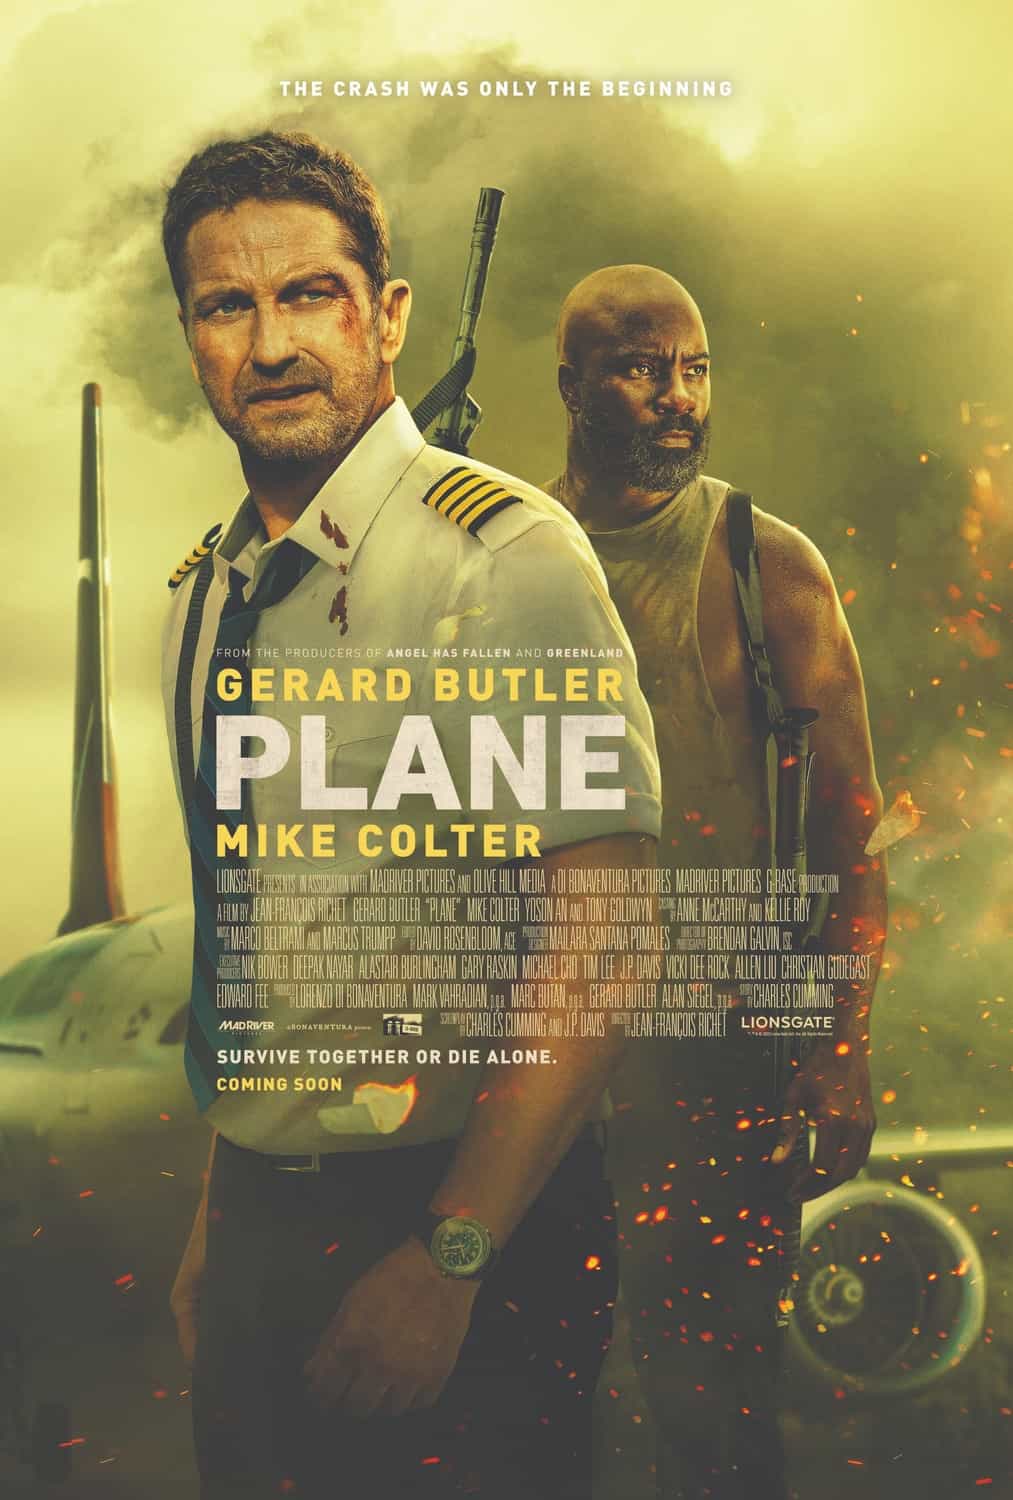 |
Plane |
£177,871 | £3,465,968 | 4 | -50% |
| 10. |  |
The Whale |
£164,701 | £1,911,687 | 3 | -56% |
| 11. |  |
Matilda: The Musical |
£142,760 | £27,587,332 | 13 | -14% |
| 12. |  |
Marcel the Shell With Shoes On |
£141,454 | £141,454 | New | |
| 13. |  |
The Fabelmans |
£118,857 | £3,140,760 | 4 | -51% |
| 14. |  |
Vaathi |
£115,999 | £115,999 | New | |
| 15. |  |
Pathaan |
£114,288 | £4,166,526 | 4 | -60% |